Return to flip book view
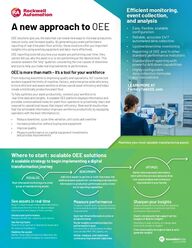
A new approach to OEEOEE solutions give you the data that can reveal new ways to increase production, reduce costs, and increase quality. By generating accurate performance reporting of real-time plant oor activity, these solutions offer you important insights into using existing equipment and labor more effectively. OEE reporting tools tell you how your assets are performing over time; they cannot tell you why the asset is or is not performing at the desired level. This solution answers the “why” question, uncovering the root causes of downtime and loss to help you make real improvements to performance.OEE is more than math – it’s a tool for your workforceFrom reducing downtime to improving quality and operations, IIoT connected workers expand the limits of machine, factory, and enterprise-wide eciency. A more ecient and aware workforce drives overall asset eciency and helps create a holistically productive plant oor.To fully optimize your asset productivity, connect your workforce to real-time data and insights. A scalable OEE platform displays information and provides contextualized views for plant oor operators to proactively react and respond to operational issues that impact eciency. Real-world results show that the actionable information improves workforce productivity by equipping operators with the best information to:• Reduce downtime, cycle time variation, unit costs and overtime• Increase production without buying new equipment• Improve quality • Measure performance on capital equipment investments and process improvementsEcient monitoring, event collection, and analysis • Easy, exible, scalable conguration• Reliable, accurate 24/7 automated data collection• Uptime/downtime monitoring• Reporting of OEE and 14 other standard performance indicators• Standardized reporting with powerful drill down capabilities• Highly congurable data collection formulas and calculationsWhere to start: scalable OEE solutionsA scalable strategy to begin implementing a digital transformation journeyMaximize your most valuable manufacturing assetsGather historical asset information, link it with other process data and drive root cause analysis and continuous improvement in your facilityAdd more assets to get line or multi-line views, link additional plant systems for correlating nonproduction information to production performance and a richer set of reporting capabilitiesReal-time asset monitoring on a small group of manufacturing assetsSee assets in real time Begin to have enough meaningful information collected within the rst 30 days to begin planning the next phase of their journeyOverall asset performance Measure downtime, capacity, and rejectsSee the top faults Move from a reactive to downtime issues and x reoccurring failuresStabilize the assets Gather meaningful production data that can be used to build ROI analysis on investmentsMeasure performance Produce insights and corrective actions to drive and document real performance improvementSpot real-time bottlenecks in a line or production areaRicher insights correlate production performance to goal Connections to non-production data sources like MRP, HR, Quality, etc. Dene, measure, and implement continuous improvement objectivesSharpen your insights Enable a baseline environment for applying advanced analytics to achieve real-time continuous improvementElastic storyboards that support ad-hoc analysis of data for insightsFlexibility to add, remove, or change data sources to produce insightsFind commonality throughout data to auto-generate insightsVISUALIZEBENCHMARKOPTIMIZELEARN MORE AT FactoryTalkOEE.com
OEE capabilitiesOEE (Throughput, Quality, Availability)AssetsAdditional AssetsProduction KPIsEquipment State AnalysisDowntime Event AnalysisEvent TrackingEntry/Editing Downtime EventsEntry/Editing Production DataMTBF/MTTR Calculations (Fault Analysis)Automatic 24/7 Data Collection From Control SystemFT Live Data ConnectivityOPC ConnectivityPre-built Performance and Production ReportsCustom ReportsAlerts Based On Data ValuesMobility/Responsive DesignGraphical Line OverviewCongurable DashboardsVisualize Multiple Data SourcesLong Term Historical Data StorageCompare Historical Data SourcesRoot Cause AnalysisTrend Analysis of Process Data••5optional••••••••••••••••••optional••••optional••15optional••••••••••••••••••••••••••••••••••optionaloptional••25optional••••••••••••••••••••••••••••••••••1000 Tags••••••Functions Visualize Benchmark OptimizeAlphabetically list all Rockwell Automation trademarks used in the publication.Positioning should be approximately 0.3” (7.62mm) from above list of locations and from below publication number.Font: Barlow Condensed, Regular, 8 pt., 80% black, centered. Publication ENCOMP-QR004I-EN-P - February 2019 | Supersedes Publication ENCOMP-QR004H-EN-P - February 2018Copyright © 2019 Rockwell Automation, Inc. All Rights Reserved. Printed in USA.Expanding human possibility, Innovation Suite, and Rockwell Automation are a trademark of Rockwell Automation, Inc.Trademarks not belonging to Rockwell Automation are property of their respective companies.Publication INFO-SP006A-EN-P - May 2020Copyright © 2020 Rockwell Automation, Inc. All Rights Reserved. Printed in USA.